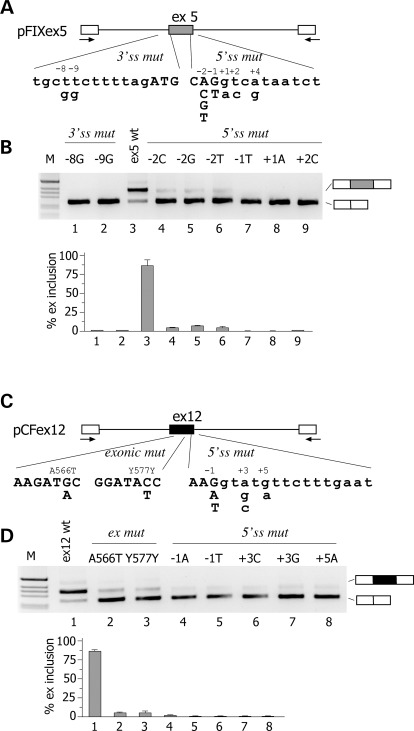
Figure 1.
Effect of natural mutations on F9 exon 5 and CFTR exon 12 pre-mRNA splicing. (A and C) Schematic representation of the central region of the pFIX exon 5 and pCFex12 minigenes, respectively. Exonic sequences are boxed, introns are lines and the arrows represent primers for PCR amplification. The position of genomic variants relative to the splice sites is indicated. Exonic and intronic sequences are in upper and lower case, respectively. (B) Analysis of pFIX exon 5-spliced transcripts. HeLa cells were transfected with pFIXex5 wt or mutant minigenes and splicing pattern evaluated by RT–PCR. Amplified products were resolved on a 2% agarose gel. The identity of the bands is indicated on the right of the panel. M is the molecular 1 Kb marker. Lower panel shows the quantification of the percentage exon 5 inclusion (mean ± SD of three independent experiments done in duplicate). (D) Analysis of pCF exon 12 spliced transcripts. HeLa cells were transfected with pFIX ex12 wt or mutant minigenes and splicing pattern evaluated by RT–PCR. Amplified products were resolved on a 2% agarose gel. Lower panel shows the quantification of the percentage exon 12 inclusion (mean ± SD of three independent experiments done in duplicate).

