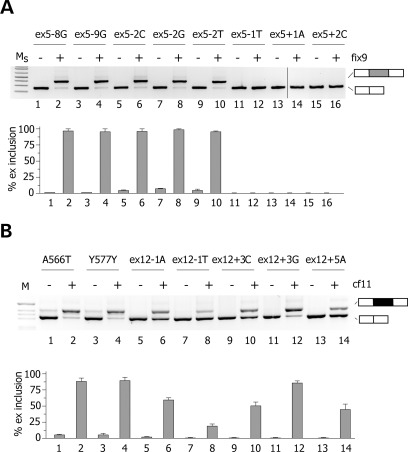
Figure 6.
Splicing correction mediated by fix9 and cf11 U1 ExSpeU1s on natural mutations. (A) HeLa cells were transfected with the indicated FIX exon 5 mutant minigenes alone (even lanes) or along with fix9 U1 ExSpeU1 (odd lanes). Splicing pattern was evaluated by RT–PCR and amplified products were resolved on a 2% agarose gel. Ms is the molecular 1 Kb plus marker. Lower panel shows the quantification of exon 5 splicing pattern. Percentage of exon inclusion is expressed as means ± SD of three experiments done in duplicate. (B) HeLa cells were transfected with the indicated CFTR exon 12 mutant minigenes alone (even lanes) or along with cf11 ExSpeU1 (odd lanes). Splicing pattern was evaluated by RT–PCR and amplified products were resolved on a 2% agarose gel. Lower panel shows the quantification of exon 12 splicing pattern. Percentage of exon inclusion is expressed as means ± SD of three experiments done in duplicate.

