Figure 6.
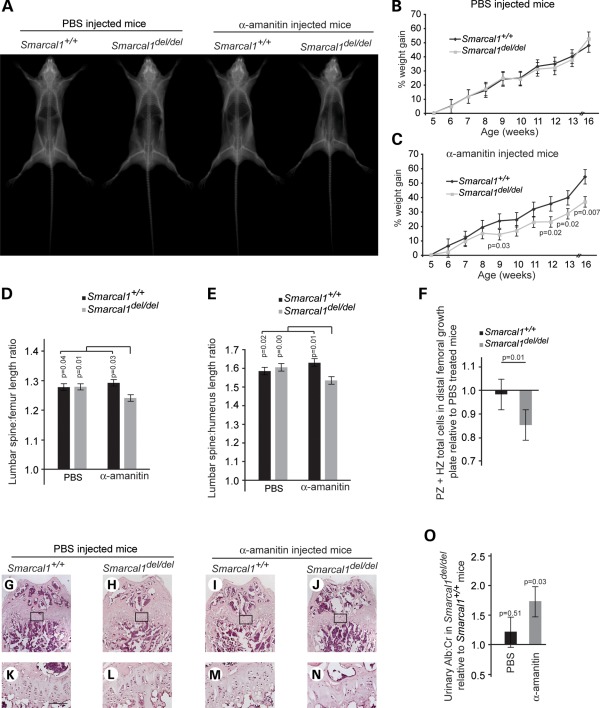
Treatment of Smarcal1del/del mice with α-amanitin partially recapitulates SIOD. (A) Radiographs of representative male mice after 12 weeks of daily intra-peritoneal (IP) injections with PBS or 0.1 mg/kg α-amanitin. (B) Growth curve showing that Smarcal1+/+ (n = 7) and Smarcal1del/del (n = 9) mice gain weight equally when given daily IP injections of PBS. (C) Growth curve showing that Smarcal1del/del (n = 9) mice gain less weight than Smarcal1+/+ (n = 7) mice when given daily ip-injections of 0.1 mg/kg α-amanitin. (D and E) Graphs showing the ratio of lumbar spine (L1–L6) length to femur length (D) or humerus length (E) for α-amanitin- and PBS-treated mice. Note that the α-amanitin treatment disproportionately shortened the lumbar spine of the Smarcal1del/del mice. (F) Plot of fold change in chondrocyte number in the proliferative (PZ) and hypertrophic (HZ) zones in the distal femoral growth plate of α-amanitin-treated mice, Smarcal1del/del (n = 7) and Smarcal1+/+ (n = 7), relative to PBS-treated mice, Smarcal1del/del (n = 7) and Smarcal1+/+ (n = 6). (G–N) Photographs of representative H&E staining of the distal femoral growth plate of Smarcal1+/+ and Smarcal1del/del male mice treated with PBS or α-amanitin for 12 weeks. (K)–(N) Higher magnifications of the boxed areas on (G)–(J), respectively. Note the hypocellular growth plate and poorly organized columns of chondrocytes in the growth plate of the α-amanitin-treated Smarcal1del/del mouse. Bar = 100 μm. (O) Graph showing urine albumin excretion by Smarcal1del/del mice relative to Smarcal1+/+ mice, following PBS or α-amanitin treatment. Bars in (B)–(F) and (O) represent standard errors.

