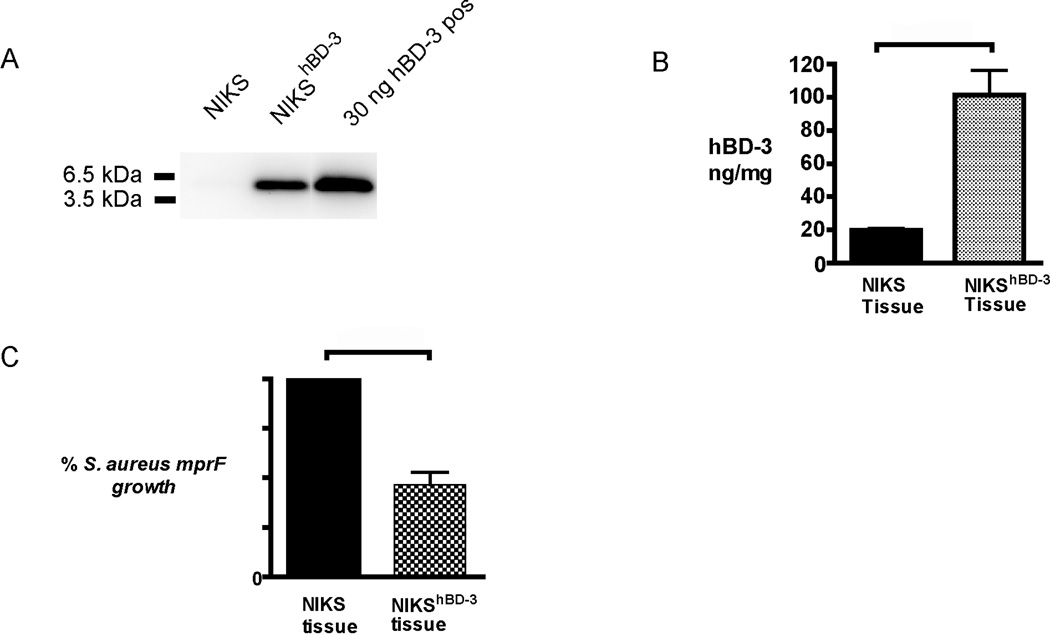
Figure 3. hBD-3 protein expression and antimicrobial activity is elevated in NIKShBD-3 tissues in vitro.
(A) Lysates of NIKS and NIKShBD-3 tissues were analyzed by immunoblot. Samples containing 15 µg of total protein were loaded per lane. 30ng chemically synthesized hBD-3 was included as a positive control. Shown is a representative blot of hBD-3. (B) hBD-3 protein levels in cell lysate detected by ELISA. Protein levels are expressed as a concentration of hBD-3 present in the total protein of cell lysate Protein expression is represented as the mean and standard error of the mean (n=3) p=0.05 calculated with the Mann-Whitney U test. (C) Conditioned medium from NIKShBD-3 tissues were tested in a kinetic bacterial assay with S. aureus mprF. Values are calculated using area under the [growth] curve (AUC) from OD measurements of bacterial growth over 5 hours and are relative to conditioned medium from tissues made with unmodified NIKS set at 100%. Percent bacterial growth represents mean and SEM of AUC (n=3). p = 0.003 calculated with the Wilcoxon signed rank test.

