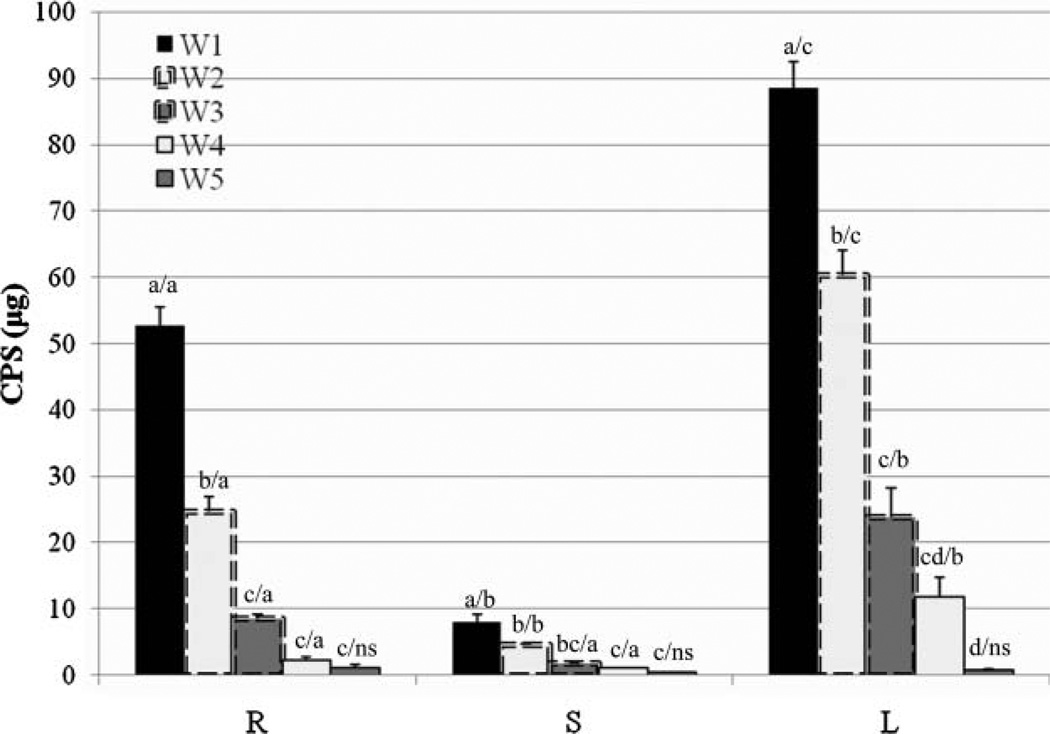
Figure 5.
The amounts of CPS remaining in hydroponic poplar plants 1 (W1), 2 (W2), 3 (W3), 4 (W4), and 5 weeks (W5) after CPS dose. Plants INRA 717-1B4 were treated with CPS for 7 days, then moved to media devoid of CPS for 4 more weeks. CPS was extracted from root (R), stem (S), and leaf (L), separately at each time point. As the results show, CPS did not persist in the plants, suggesting further metabolism of CPS in plant tissue. The data are shown as the mean ± SEM from five plant samples. Different letters denote significant differences at P < 0.05 (first letter: five time periods for a given plant tissue; second letter: three parts of plant for a given time period); ns denotes non-significant difference at the 0.05 level. P values for the microgram of CPS are 0.000 (R, S, L, W1, and W2), 0.001 (W3 and W4), and 0.276 (W5).

