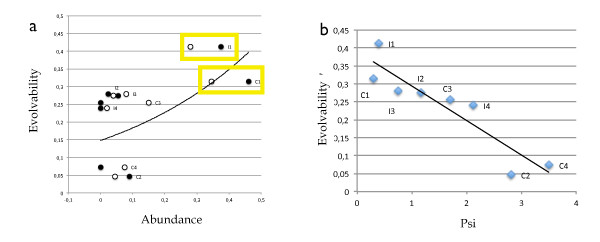
Figure 6.
FFL evolvability. In plot (a) we show the correlation between the motif's evolvability and its abundance. Evolvability ε, which is found to positively correlate with ρ(Γi), is highest for the most abundant motifs C1, I1. In black we show data point of S. cerevisiae, in white E. coli. In (b) we show the correlation between the FFL's evolvability and its ψ(Γi). We calculate a Pearson coefficient of r = -0.92 for the linear fit. The lower ψ(Γi), the higher the motif's plasticity and the higher its evolvability. The data points are developed from the motifs topology and thus are species independent (blue).

