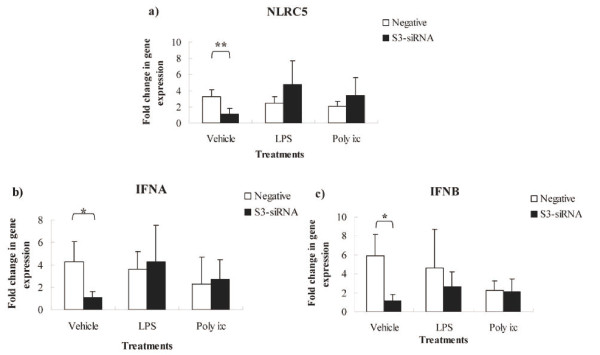
Figure 2.
Gene expression of NLRC5, IFNA, and IFNB in s3-siRNA transfected HD11 macrophages cells after vehicle-treatment, LPS (1 μg/ml), and poly (I:C) (0.1 ng/ml) treatment at 4 hps. Data are shown as the fold change in expression for each gene between s3-siRNA and negative siRNA transfections, among vehicle-treatment, LPS treatment, and poly (I:C) treatment. a: NLRC5; b: IFNA c: IFNB. RNA assays were carried out in triplicates by qPCR. P values are flagged with asterisks when lower than 0.05 (*), 0.01 (**).

