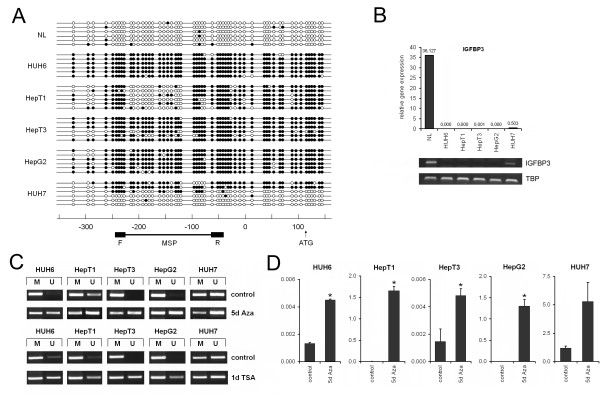
Figure 2.
(A) Methylation status of the IGFBP3 promoter in HB cell lines. Bisulfite sequencing of the 5' region of IGFBP3 was performed in the indicated liver tumor cell lines and normal liver (NL) tissue. The open and filled circles represent unmethylated and methylated CpG sites, respectively. The location of each CpG site relative to the transcription start site (in base pairs) and the region used for MSP analysis, including the forward (F) and reverse (R) primer, is shown below. (B) mRNA level of IGFBP3 in HB cell lines. Expression of IGFBP3 was measured in normal liver tissue (NL) and in the liver tumor cell lines HepG2, HepT1, HepT3, HUH6, and HUH7 by real-time and RT-PCR. The values represent the relative gene expression in relation to the house-keeping gene TBP. (C) Demethylation of the IGFBP3 promoter region after 5-Aza-dC or trichostatin A treatment. Cells were incubated for 5 days with 5-Aza-dC and 24 hours with trichostatin A. Methylation status (U, unmethylated; M, methylated) of the IGFBP3 promoter region was determined using MSP. Representative images of the MSP experiments are given. (D) Restoration of IGFBP3 expression. The reactivation of IGFBP3 expression after 5 days of 5-Aza-dC treatment in HB cell lines, as revealed by real-time PCR. Statistically significant difference versus untreated cells: *P < 0.05 (unpaired Student's t-test).

