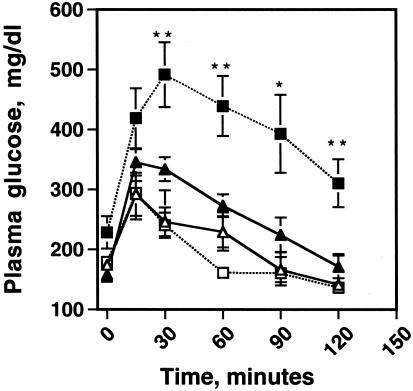
Figure 5.
Peri null animals exhibit a greater tendency toward glucose intolerance than wt mice. Fourteen-week-old male littermates, both wt and perilipin null mice, were fasted overnight and challenged with an i.p. injection of 1 g of glucose per kilogram of body weight. Plasma glucose values were measured at the times indicated after injection by using a Glucometer Elite blood glucose meter (Bayer). Triangles show wt and squares show peri null mice. Open symbols are animals <30 g, and closed symbols are animals >30 g. Values are means ± SEM, n = 6 per group. Student's t test, different from wt: *, P = 0.01, **, P = 0.005.

