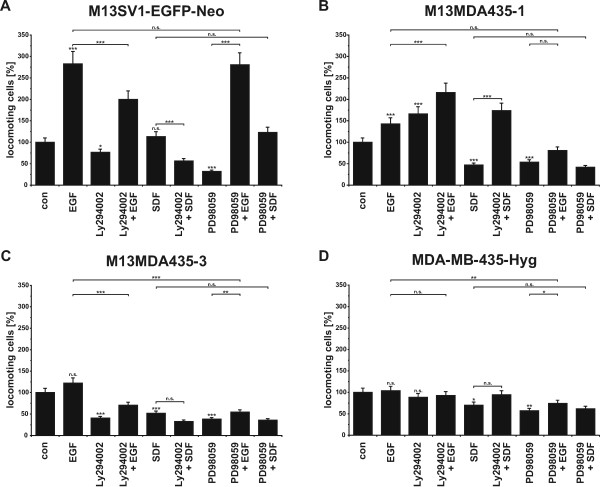
Figure 2.
Cell migration data. The migratory activity was analyzed using the 3D collagen matrix migration assay combined with time-lapse video-microscopy. For a better comparison of the EGF and SDF-1α specific, values of each cell type were calculated in relation to untreated control values, which were set to 100%. Cells were stimulated with 100 ng/ml EGF; 1 μg/ml SDF-1α, 500 nM L294002, and 500 nM PD98059. A) M13SV1-EGFP-Neo breast epithelial cells, B) M13MDA435-1 hybrid cells, C) M13MDA435-3 hybrid cells, D) MDA-MB-435-Hyg breast cancer cells. Statistical significance was calculated using Student's t-test: n.s. = not significant; * = p < 0.05; ** = p < 0.01; *** = p = 0.001.

