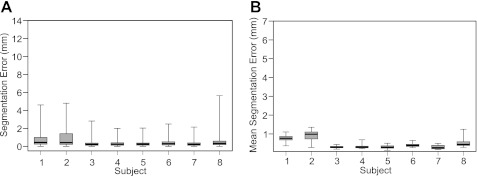
Fig. 3.
Box and whisker plots showing the error of the segmentation using the active shape model extensions for skeletal muscle (ASM*) in each participant. Error was the absolute distance between the manually and ASM* defined position of each landmark. A: errors calculated from each landmark within each analyzed image (total 76 landmarks × 75 frames = 5,700 points in each box). B: mean error from all landmarks within each image (total 75 frames = 75 points in each box), providing an indication of the overall quality of the image segmentation. In both plots, middle bar represents the median value, bottom and top of the box represent the 25th and 75th percentiles, respectively, and the whiskers represent the minimum and maximum values. See appendix b, for comparison of results with a standard ASM.

