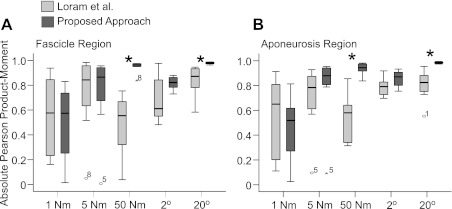
Fig. 4.
Box and whisker plots showing Pearson product-moment correlation for footplate signal (torque or ankle joint angle) and the proposed approach (dark boxes) or the cross-correlation approach (13) (lighter boxes) for the fascicle region (A; contractile tissue displacement) and the aponeuroses (B; aponeurosis displacement). Asterisks denote significant differences between approaches (P < 0.05). Middle bar represents the median value, bottom and top of the box represent the 25th and 75th percentiles, respectively, and the whiskers represent the minimum and maximum values (less outliers, which are shown as individual points and labeled with the appropriate participant number; N = 8).

