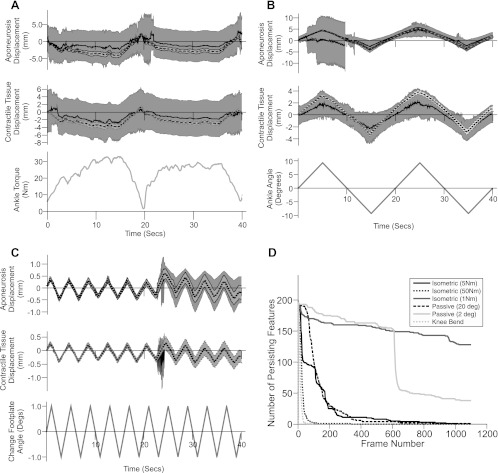
Fig. 5.
Changes in aponeurosis length and contractile tissue displacement for a representative subject (S6) during 50-Nm isometric contraction (A), 20° ankle joint rotations (B), and 2° ankle joint rotations (C). Each displacement graph shows results from the proposed approach (mean: black, broken line; ±1 SD: light grey shaded area) and the cross-correlation approach (13) (mean: black, solid line; ±1 SD: dark grey shaded area). Mean and SD values were calculated from displacements of the 8 rows of regions of interest (see Fig. 1). Note how the mean displacement from the proposed approach and the cross-correlation approach are often in close agreement but that the variation in these data is much higher for the cross-correlation approach, especially for the larger movements. Recorded ankle torque and angle are shown at bottom (grey line). D: persistence of features present in frame 1 over subsequent image frames for each condition. Note the rapid drop in the number of persisting features for larger movements.

