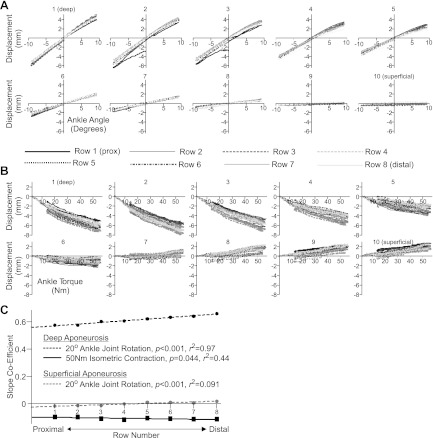
Fig. 7.
Vertical displacement of all probes during 20° ankle joint rotations (A) and 50-Nm isometric contractions (B) from participant S2. All values have been normalized to position at the first frame. Each graph displays displacement of all probes within the defined column (1–10, see Fig. 1), with each row (1–8, see Fig. 1) defined by line style. In both conditions, the largest differences in the pattern of displacement occur from deep to superficial regions (comparing graphs 1–10 in A and B). Note: 1) how the pattern of displacement within each graph is more dispersed during isometric contractions, a consistent feature across all participants and potential indicator of active vs. passive changes in muscle shape (see Distinguishing Between Active and Passive Muscle Movements); and 2) differences in displacement direction between deep and superficial regions during active contraction but not passive ankle joint rotation. C: slope coefficients describing the best fit line fitted to plots of vertical displacement vs. angle (circles, 20° condition) or torque (squares, 50-Nm condition) of each of the 8 probes in the deep (black, column 1) and superficial (grey, column 10) aponeurosis (i.e., each line in graphs 1 and 10 in A and B). Data were taken from S7. Data points are shown where regression analysis revealed a significant relationship across row position: deep aponeurosis during both active and passive conditions; the superficial aponeurosis during passive ankle joint rotations, with details provided in the graphic.

