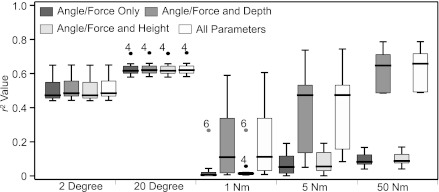
Fig. 8.
Box and whisker plots representing results of multiple regression analysis, predicting displacement of all 80 probes. For each condition four analyses were conducted, with dependent variables defined as angle/force only (dark grey boxes), angle/force and deep-superficial depth (col. number, Fig. 1; midgrey boxes), angle/force and proximal-distal location (row number, Fig. 1; light grey boxes), and all parameters (angle/force, depth and proximal-distal location; white boxes). Analysis for all subjects and each of the 5 experimental conditions are shown. Middle bar represents the median value, and bottom and top of the box represent the 25th and 75th percentiles, respectively, and the whiskers the minimum and maximum values (less outliers, which are shown as individual points and labeled with the appropriate participant number); N = 8.

