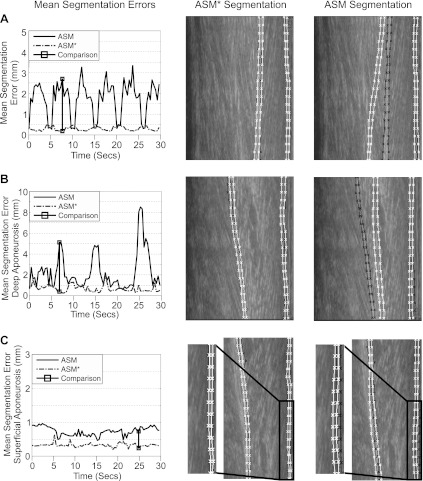
Fig. B2.
Comparison of segmentation defined by ASM and ASM* illustrating how ASM* implementation outperforms the standard ASM settings. A: participant S3. B: participant S8; C: participant S2. Left: mean segmentation error calculated as the mean error of all 76 (A) and 38 landmarks (B and C) in each tested image from both ASM (black, solid line) and ASM* (grey, broken line). Vertical line highlights a time when segmentation using ASM* provides a more accurate recovery of the aponeurosis (middle) compared with segmentation using ASM (right). At middle and right, hand-labeled contours are shown in black, with the respective segmentation shown in white.

