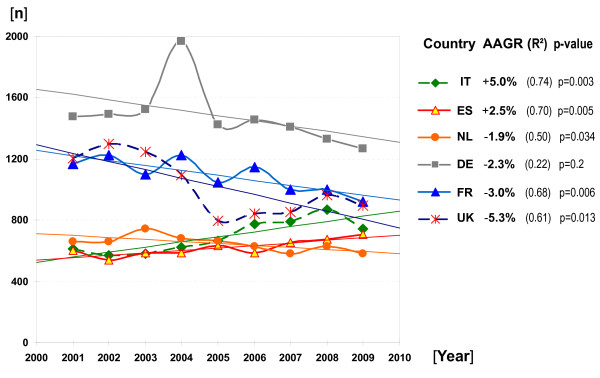
Figure 1.
Annual Clinical Trial Applications (CTA) and Average Annual Growth Rates (AAGR) for the period 2001 to 2009. Figures for Germany comprise merged data for both national competent authorities (BfArM and the Paul-Ehrlich-Institute). Figures for the UK do not comprise phase I trials (often referred to in the UK as 'trials with healthy volunteers').

