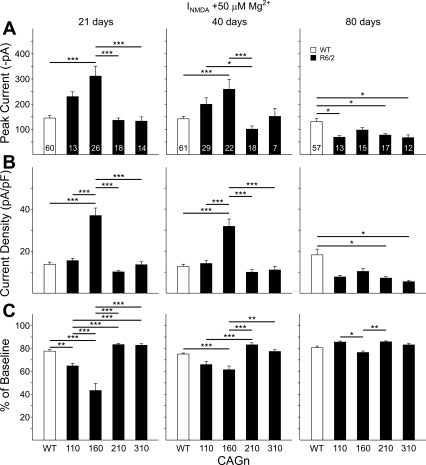
Fig. 5.
A: mean (±SE) peak current amplitude in ACSF containing 50 μM Mg2+ for pooled WTs and each CAG repeat group at 21, 40, and 80 days. Example traces are shown in Fig. 4. B: mean (±SE) peak current density (peak current/capacitance) for the same groups shown in A. C: mean (±SE) percent reduction in peak current produced by the addition of 50 μM Mg2+ in the ACSF for the same groups shown in A and B. Lines over bars indicate statistically significant group comparisons: *P < 0.05, **P < 0.01, ***P < 0.001. Data from 21- and 40-day CAG160 line were published previously (Starling et al. 2005).

