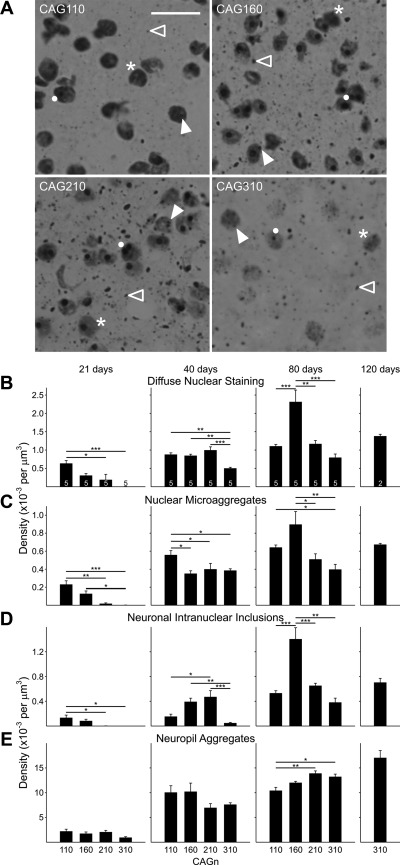
Fig. 9.
A: photomicrographs of EM48-stained striatal sections from 80-day-old mice. Each image shows an example of a diffusely stained nucleus (asterisk), a nuclear microaggregate (closed arrowhead), a neuronal intranuclear inclusion (NII; solid dot), and a neuropil aggregate (open arrowhead). Note that an individual cell could be counted multiple times. For example, a cell may contain 2 NIIs, may also contain nuclear microaggregates, or also have diffuse nuclear staining. Original scale bar (in CAG110 image) is 10 μm and refers to all images. B–E: mean (±SE) density plotted at each age and for each protein conformation for the 4 different CAG repeat lengths. Sample size (number of animals) is indicated in B as numbers inside (or above) the bar. Lines over bars indicate statistically significant group comparisons: *P < 0.05, **P < 0.01, ***P < 0.001.

