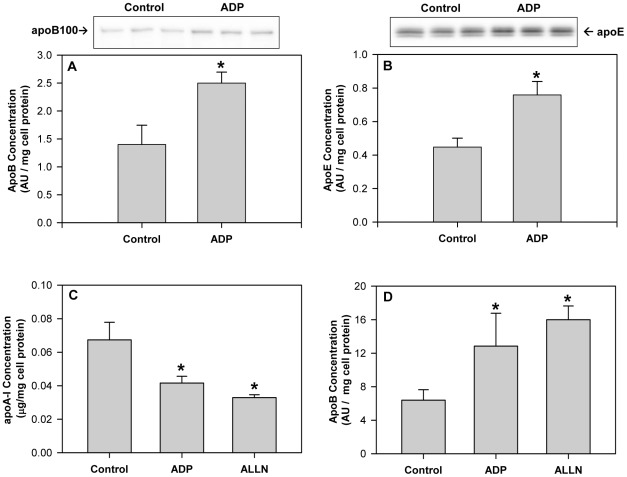
Figure 2. ADP stimulates apoB100 and apoE secretion.
(A&B) HepG2 cells were incubated with 100 µM adenosine diphosphate (ADP) for 24 h in serum-free DMEM media. Conditioned media was collected and immunoblotted for apoB100 (A) and apoE (B). Histograms represent band densitometry analysis of apoB100 or apoE, normalized to total cell protein and expressed as mean ± SD of 3 independent experiments. *P<0.01 vs Control. (C&D) HepG2 cells were treated with 100 µM adenosine diphosphate (ADP) or 25 µM ALLN (N-Acetyl-L-leucyl-L-leucyl-L-norleucinal) for 4 h in serum-free DMEM media. (C) Conditioned media was collected and apoA-I concentration was quantified by ELISA. ApoA-I concentration in the media is normalized to total cell protein and expressed as mean ± SD of 3 independent experiments. *P<0.05 vs Control. (D) ApoB100 concentration in the media was determined by Western blot and histograms represent band densitometry analysis of apoB100, normalized to total cell protein and expressed as mean ± SD of 3 independent experiments. *P<0.05 vs Control.

