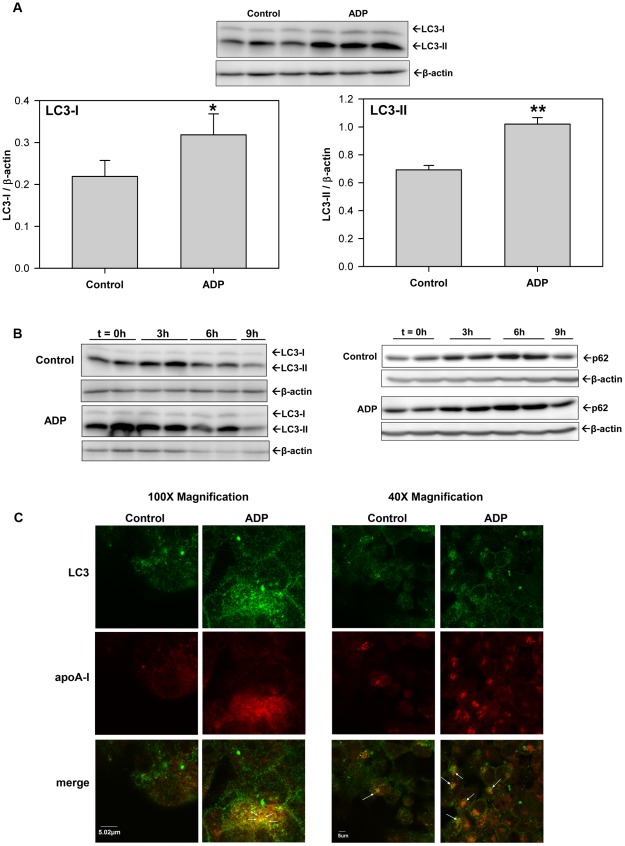
Figure 3. ADP stimulates autophagy and increases cellular LC3-II.
(A) HepG2 cells were treated with 100 µM adenosine diphosphate (ADP) for 4 h in serum-free DMEM media. Cell lysates were immunoblotted for LC3. Histograms represent band densitometry analysis of LC3-I and LC3-II, normalized to β-actin and expressed as mean ± SD of 3 independent experiments. *P<0.05 vs Control, **P<0.001 vs Control. (B) HepG2 cells were serum-starved (Control) or pretreated for 30 min. with 100 µM adenosine diphosphate (ADP) in serum-free DMEM media and then lysates were harvested at the indicated timepoints (0, 3, 6 & 9 h). (Left panels) Cell lysates were immunoblotted for LC3 and β-actin. (Right panels) Cell lysates were immunoblotted for p62 and β-actin. Blots are representative of 2 independent experiments. (C) HepG2 cells were serum-starved (Control) or treated with 100 µM ADP in serum-free DMEM media for 4 h. Cells were fixed and permeabilized and then LC3 and apoA-I were detected by indirect immunofluorescence using primary antibodies against human LC3 and apoA-I, and Alexa Fluor-conjugated secondary antibodies (Alexa Fluor 488 goat anti-rabbit Ab (green for LC3) and Alexa Fluor 647 anti-mouse Ab (red for apoA-I)) by confocal microscopy. Micrograph 100× and 40× images of representative cells from 2 independent experiments done in quadruplicate are shown.

