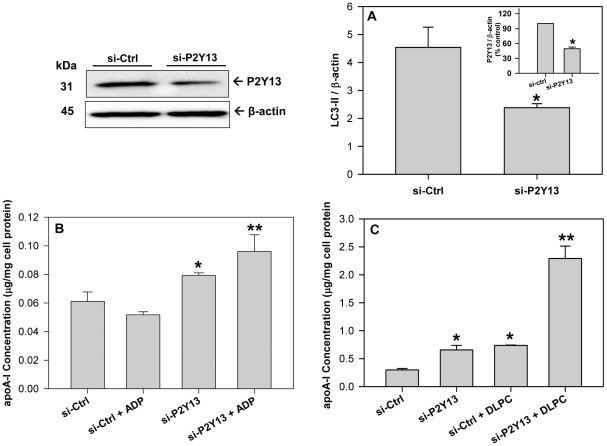
Figure 5. Reducing P2Y13 expression blocks autophagy and stimulates apoA-I secretion.
HepG2 cells were transfected with either a negative control (si-ctrl) or a siRNA against human P2Y13. Cell lysates were collected 48 h after transfection and immunoblotted for P2Y13 to confirm protein knockdown (Upper left panel). (A) Cell lysates were immunoblotted for LC3 and histograms represent band densitometry analysis of LC3-II, normalized to β-actin, and expressed as mean ± SD of 3 independent experiments. *P<0.05 vs si-Ctrl. (Inset A) Histograms represent band densitometry analysis of P2Y13 normalized to β-actin and expressed as mean ± SD of 3 independent experiments. *P<0.05 vs si-Ctrl. (B) Transfected cells were treated with 100 µM ADP in serum-free DMEM media for 4 h, conditioned media was collected and apoA-I concentration was quantified by ELISA. ApoA-I concentration in the media is normalized to total cell protein and expressed as mean ± SD of 3 independent experiments. *P<0.05 vs si-Ctrl, **P<0.05 vs si-P2Y13 (C) Transfected cells were treated with 12 µM DLPC in serum-free DMEM media for 24 h, conditioned media was collected and apoA-I concentration was quantified by ELISA. ApoA-I concentration in the media is normalized to total cell protein and expressed as mean ± SD of 3 independent experiments. *P<0.01 vs si-Ctrl, **P<0.001 vs si-Ctrl+DLPC.

