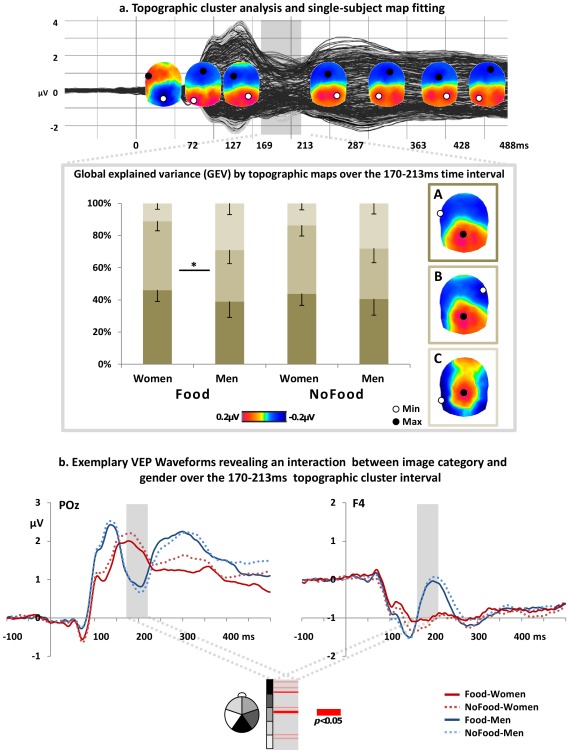
Figure 2. Results of VEP analyses.
(a) A topographic cluster analysis incorporating the group-average VEPs of both genders to both image categories (food and non-food) revealed eight VEP cluster periods. Statistics on the (back-)fitting of group-average topography to single subject VEPs revealed that topographic map presence (as measured by global explained variance GEV) was modulated by gender and image category over the 170–213 ms interval after image onset. Bar graphs illustrate the GEV (± s.e.m.) of each topography present over the 170–213 ms interval (i.e. map A, B or C) in the responses of women and men when viewing images of food and non-food. The asterisk illustrates significant differences between the presence of map B between female and male responses to food as obtained from post-hoc t-tests. (b) Exemplar VEP waveforms from both genders in response to food- and non-food viewing at a posterior parietal (POz) and a right frontal electrode (F4). Below, a p-value plot illustrates over which scalp region electrode sensors ( = 160) revealed a reliable interaction between image category and gender over the 170–213 ms interval.

