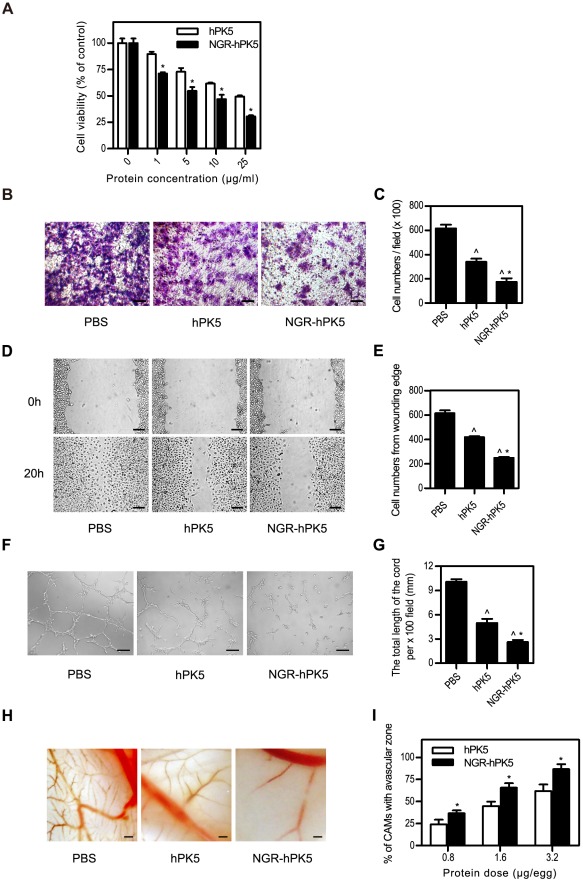
Figure 2. Antiangiogenic activity assessment of NGR-hPK5.
A , MTT assay. HUVECs were treated with different concentrations of hPK5 or NGR-hPK5 (1, 5, 10 or 25 µg/ml) for 48 h. Cell viability (%) = average A570 nm of treated group/average A570 nm of control group×100%. N = 4. B & C , Transwell assay. HUVECs were treated with 5 µg/ml of hPK5 or NGR-hPK5. After 16 h pretreatment and 9 h incubation in the upper chamber, the cells migrating to the lower membrane were stained and counted in five fields with a magnification of ×100. N = 3, bar = 50 µm. D & E , Wound healing assay. HUVECs were treated with 5 µg/ml of hPK5 or NGR-hPK5. After 20 h healing period, the cells migrating into the wound area were visualized and quantified with a magnification of ×100. N = 3, bar = 100 µm. F & G , Cord morphogenesis assay. HUVECs were treated with 10 µg/ml of hPK5 or NGR-hPK5. After 16 h pretreatment and 8 h incubation on Matrigel, the networks of cords were photographed and the total length of the cord was measured in five fields under a microscope with a magnification of ×100. N = 3, bar = 100 µm. H & I , Chick CAM assay of angiogenesis. Representative CAMs from 8-day-old chick embryos, which were treated with different doses of hPK5 or NGR-hPK5 (0.8, 1.6 or 3.2 µg/egg) for 48 h. The data was calculated as the percentage of the positive eggs (formation of avascular zones ≥5 mm in diameter) relative to the total eggs tested. N = 10, bar = 600 µm. PBS was used as buffer control. All experiments were conducted in triplicate. * p<0.05 compared with hPK5, ∧ p<0.05 compared with control.

