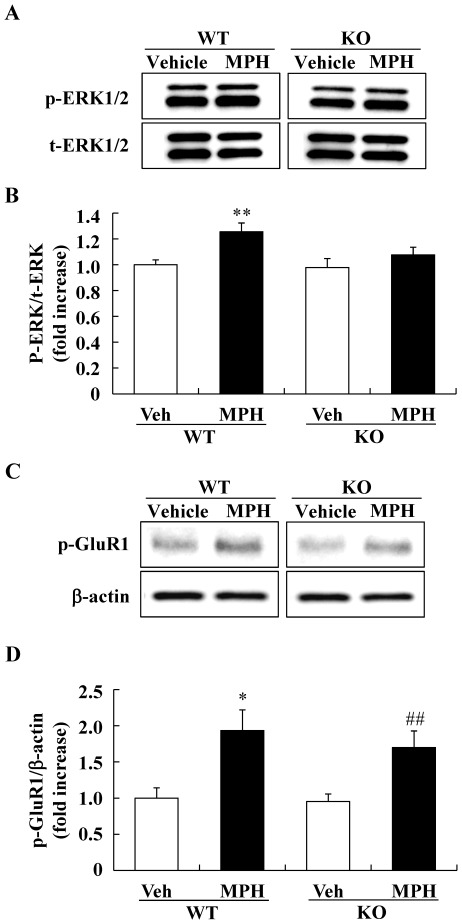
Figure 5. Western blot analysis of the phosphorylation levels of ERK1/2 and GluR1 in the striatum.
Phosphorylated and total ERK1/2 levels in the striatum were measured by Western blot analysis. (A) Representative immunoblots showing the expression levels of phosphorylated ERK1/2 (p-ERK1/2) and total ERK1/2 (t-ERK1/2) in the striatum of WT and DGKβ KO mice 5 min after drug treatment. (B) Phosphorylation levels of ERK1/2 are quantified relative to the t-ERK1/2 levels. Values are expressed as the mean ± S.E.M. (n = 5 to 8) **; p<0.01 v.s. vehicle-treated WT mice group (t-test). (C) Representative immunoblots showing the expression levels of phosphorylated GluR1 (p-GluR1) in the striatum of WT and DGKβ KO mice 40 min after drug treatment. (D) Phosphorylation levels of GluR1 are quantified relative to the β-actin levels. Values are expressed as the mean ± S.E.M. (n = 6 to 8) *; p<0.01 vs. vehicle-treated WT mice group, ##; p<0.01 vs. vehicle-treated KO mice group (t-test).

