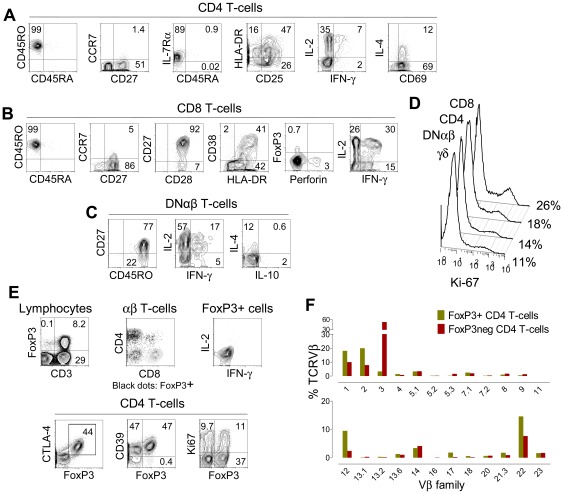
Figure 1. Peripheral T-cells prior to thymus transplantation in a patient with R255X FOXN1 mutation.
At day 166 of life there were 10.4% (660 cells/µl) CD4 T-cells, 9.7% (612 cells/µl) CD8 T-cells; and 10.7% (676 cells/µl) DNαβ T-cells in the peripheral blood. CD4+ (A), CD8+ (B), and DNαβ T-cells (C) exhibited a memory-effector activated phenotype and were able to produce significant amounts of IL-2, IFN-γ and IL-4. (D) Percentages of cycling cells, as assessed by Ki-67 expression, within CD8, CD4, DNαβ and γδ T-cells. (E) Dot-plots showing that: FoxP3 expression is restricted to CD3+ cells; that within total FoxP3+ cells (328 cells/µl) there were 67% CD4+, 17% DNαβ and 12% cells co-expressing CD4 and CD8 (DP, DP represented 3% of total αβ cells and 26% of them were FoxP3+) as illustrated by the expression of CD4 and CD8 within total αβ cells (grey) and within FoxP3+ cells (black); the concomitant expression of FoxP3 with other Treg markers (CTLA-4, CD39), or Ki-67 within total CD4+ T-cells; and the lack of cytokine production by FoxP3+ cells. (F) Vβ distribution within FoxP3+ and FoxP3− CD4 T-cells performed at day 254 of life. Graphs show the proportion of FoxP3+ CD4 T-cells and FoxP3− CD4 T-cells belonging to a given Vβ family as assessed by flow cytometry. Dot-plots show analysis after gating on the respective populations; numbers within each quadrant represent the proportion of cells expressing the respective molecules. Cytokine production was assessed after 4 hours stimulation of PBMC with PMA plus Ionomycin in the presence of Brefeldin A.

