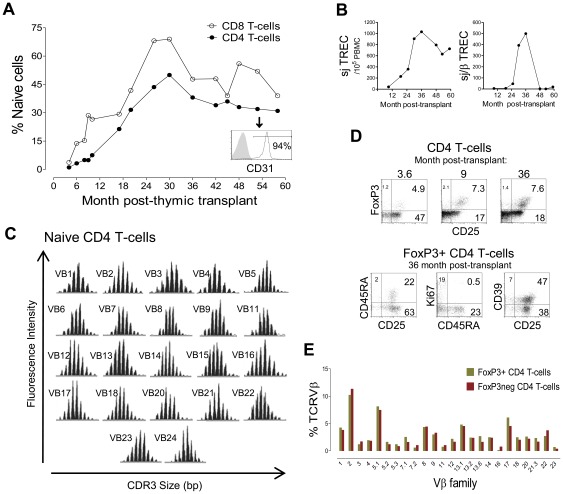
Figure 2. Immunological reconstitution and Treg recovery after thymic transplantation in a patient with R255X FOXN1 mutation.
(A) Kinetics of the frequency of naïve cells (CD45RA+CD27+) within CD4 and CD8 T-cell subsets; histogram shows CD31 expression within naïve CD4 T-cells at 58 months post-transplant, a marker associated with recent thymic emigrants. (B) Longitudinal quantification of sjTREC (left) and sj/βTREC ratio (right) quantified in total PBMC. (C) Assessment of TCR repertoire by spectratyping analysis of the CDR3 Vβ regions of purified naïve CD4 T-cells at 59 months post-transplant. (D) Representative dot-plots of the longitudinal analysis of the frequency of cells expressing FoxP3 and/or CD25 within total CD4 T-cells (upper dot-plots), and the phenotype of circulating FoxP3+ cells at 36 months post-transplant after successive gates on CD4+ and FoxP3+ T-cells (lower dot-plots); numbers inside quadrants represent the frequency of cells expressing the indicated molecules. (E) Graph shows the proportion of circulating FoxP3+ and FoxP3− CD4 T-cells belonging to each of the Vβ families at 48 months post-transplantation analysed by flow cytometry.

