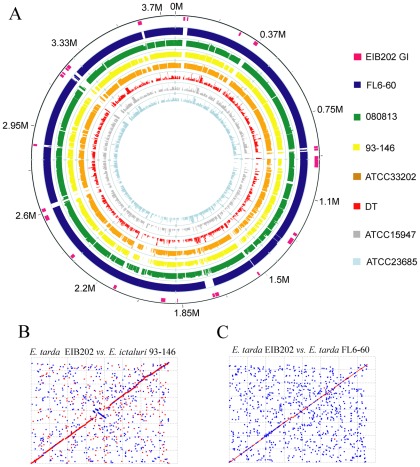
Figure 2. Schematic comparison of the Edwardsiella genomes.
(A) The outside circle represents E. tarda EIB202 GIs (pink). The next 7 circles ranging from outside to inside show the coordinated mapping of 2 complete genomes (E. tarda FL6-60 and E. ictaluri 93–146) and 5 contig sets of genomes against E. tarda EIB202 reference genome sequence. (B and C) Dot plot comparison of MUMmer nucmer output between E. tarda EIB202 (x-axis) and E. ictaluri 93–146 (y-axis) (B), or between E. tarda EIB202 (x-axis) and E. tarda FL6-60 (y-axis) (C). Red and blue plot means forward and reverse matches, respectively.

