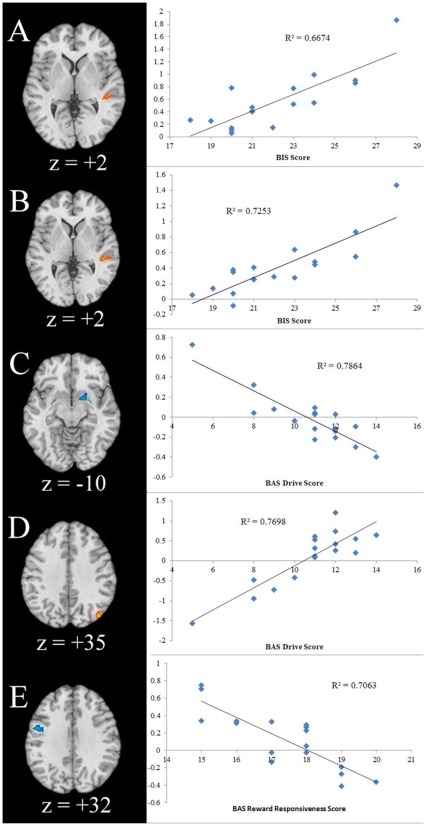
Figure 3. Regional Brain Activations during the Perception of Infant Cries and Faces Correlated with Behavioral Measures of Motivation as Assessed by BIS/BAS Subscales.
a) Axial slice of regional brain response for low-distress cry versus pink noise that correlates with scores on the BIS scale. b) Axial slice of regional brain response for high-distress cry versus pink noise that correlates with scores on the BIS scale. c) Axial slice of regional brain response for high-distress cry versus pink noise that correlates with scores on the BAS drive scale d) Axial slice of regional brain response for sad versus neutral infant faces that correlates with scores on the BAS drive scale. e) Axial slice of regional brain response for low-distress cry versus pink noise that correlates with scores on the BAS reward-responsiveness scale. Color on T1 template images from SPM5 indicates significant increases (red color) and decreases (blue color) in BOLD signal. The right side of the brain is on the right. The number under each brain image indicates z-axis coordinates of the image in the MNI (Montreal Neurological Institute) template space. The only voxels displayed on the brain images are regions with corrected p<.002 threshold at an uncorrected voxel-level threshold of p<.0005 at each tail and a cluster of 17.

