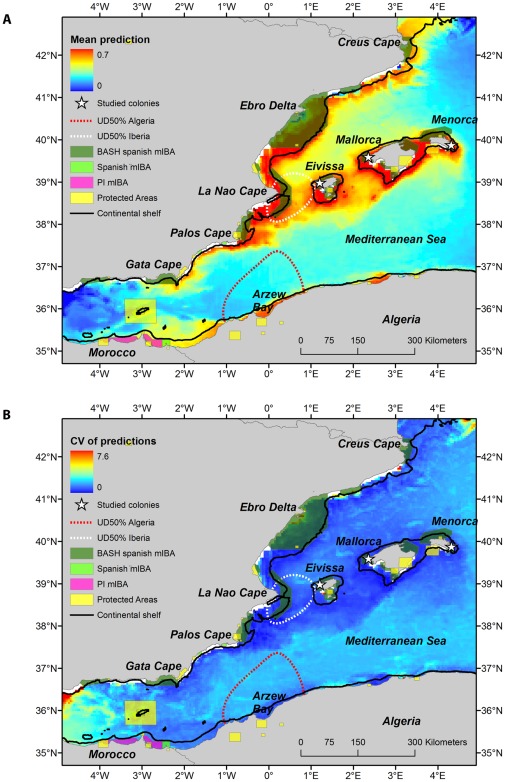
Figure 5. Species distribution modelling output for southern Balearic shearwaters distribution in June 2011: (a) mean prediction and (b) coefficient of variation.
The position of the studied colony (white triangle), the two key marine areas (indicated by the 50% UD) around Cape La Nao and Arzew Bay, and the 200 m isobath (i.e. the limit of the continental shelf) are shown (black line). In addition, limits of current Protected Areas are placed by yellow polygons in the western Mediterranean [56], as well as Spanish marine Important Bird Areas (mIBAs) for Balearic shearwaters (BASH) (dark green polygons), other Spanish mIBAs (light green polygons) and potentially important (PI) mIBAs in international waters (violet polygons) [18].

