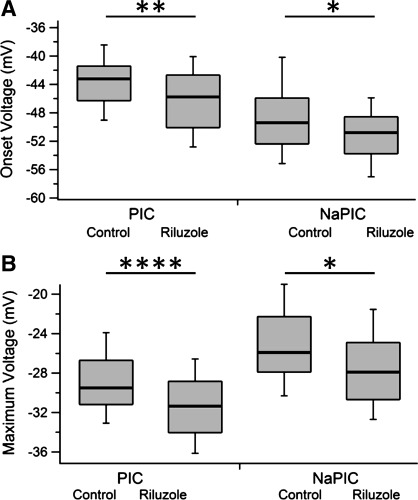
Fig. 2.
PIC and NaPIC onset and max voltages by drug condition. A: onset voltages for the PIC (left) and the NaPIC (right) by drug condition. B: max voltage for the PIC (left) and NaPIC (right) by drug condition. Each is presented as a box plot with median (thick line), 25% (top line), 75% (bottom line), 10% (top whiskers), and 90% (bottom whiskers). Box plots instead of means and SDs were used because the NaPIC onset voltage was nonparametric and to better show the actual distributions. Data shown are pooled across wt and SOD1 neurons as there was no significant main effect of genotype. See Table 2 for data separated by genotype and drug condition (4 groups) and ANOVA results. Significance: *0.05 ≥ P > 0.01, **0.01 ≥ P > 0.001, ****P ≤ 0.0001.

