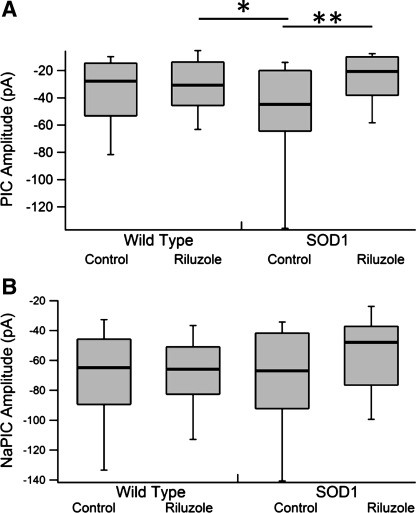
Fig. 3.
PIC and NaPIC amplitudes by drug condition and genotype. A: PIC amplitude with genotype [wt (left) and SOD1 (right)] by drug condition with pairwise differences. Note the decrease in PIC amplitude in SOD1 neurons treated with riluzole. B: NaPIC amplitude with genotype [wt (left) and SOD1 (right)] by drug condition. Note the lack of significant pairwise differences. Each is presented as a box plot with median (thick line), 25% (top line), 75% (bottom line), 10% (top whiskers), and 90% (bottom whiskers). Box plots instead of means and SDs were used because the PIC amplitude was nonparametric and to better show the actual distributions. See Table 2 for ANOVA results. Significance: *0.05 ≥ P > 0.01, **0.01 ≥ P > 0.001.

