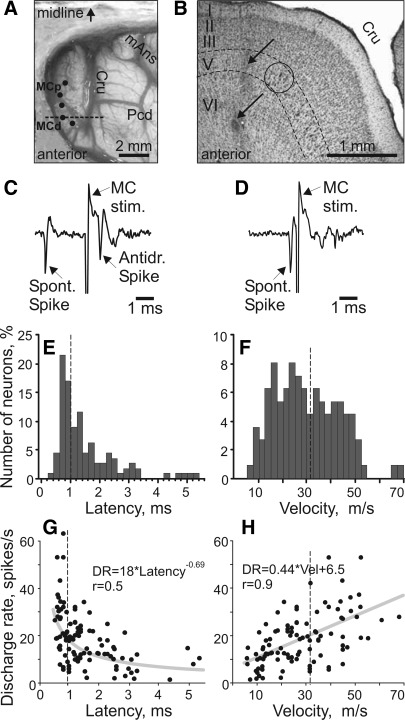
Fig. 5.
Axonal conduction velocities of thalamo-cortical projection neurons (TCs). A: photograph of the dorsal surface of the left frontal cortex of cat B. Entrance points of stimulation electrodes into the precruciate sulcus are schematically shown by black dots. Electrodes were placed in the paw (the motor cortex distal forelimb representation, MCd) and the elbow and shoulder (the motor cortex proximal forelimb representation, MCp) as determined by multiunit recording and microstimulation procedures. The position of the parasagittal section, whose photomicrograph is shown in B, is indicated by a dashed line. Cru, cruciate sulcus; Pcd, postcruciate dimple; mAns, medial ansate sulcus. B: photomicrograph of a parasagittal section through the rostral precruciate gyrus stained with cresyl violet. Layers of cortex are numbered. Layer V, which contains giant pyramidal cells, is highlighted by dashed lines. One of the clusters of giant cells in layer V that are characteristic for area 4γ is circled. Arrows point to a track and an electrolytic lesion made by a stimulation electrode that was placed in layer VI. C: stimulation of the motor cortex evoked a spike in a TC neuron with a latency of 0.8 ms. D: to determine whether this spike was elicited antidromically, on the next trial a spontaneous spike of the neuron was used to trigger cortical stimulation with 0.4-ms delay. Stimulation delivered with a delay smaller than the time needed for a spontaneous spike to reach the site of stimulation (that is, approximately equal to the latent time of an antidromic spike) was not followed by a response. This indicated a collision of ortho- and antidromically conducted spikes and confirmed the antidromic nature of the evoked spike. E: distribution of latencies of antidromic responses to stimulation of the motor cortex of all 116 TC neurons whose activity was recorded during locomotion. F: distribution of estimated conduction velocities. In E and F dashed lines separate “fast” (latencies 0.4–1.0 ms)- and “slow” (latencies 1.1–6.0 ms)-conducting neurons. G: relationship between the mean discharge rate of individual neurons in the resting animal and their antidromic latency, approximated with a power function. H: relationship between the mean discharge rate of individual neurons in the resting animal and axonal conduction velocity, approximated with a linear regression. r, Coefficient of correlation.

