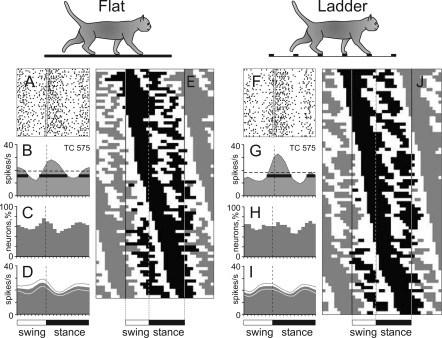
Fig. 8.
Population characteristics of two-PEF neurons. A and B and F and G: example activity of a typical neuron (group II neuron, see Fig. 13) during walking on the flat surface (A, B) and along the horizontal ladder (F, G). Activity is presented as a raster of 50 step cycles (A, F) and as a histogram (B, G). In rasters, the end of swing and the beginning of the stance phase in each cycle is indicated by an open triangle. In histograms, the horizontal interrupted line indicates the average discharge frequency during standing; the horizontal black bar shows PEFs. C and H: proportion of active neurons (neurons in their PEF) at different phases of step cycle during simple (C) and ladder (H) locomotion. D and I: mean discharge rate during simple (D) and ladder (I) locomotion. Thin lines show SE. E and J: phase distribution of PEFs during simple (E) and ladder (J) locomotion. Each trace shows PEFs of 1 neuron (shown in black in 1 cycle only). Vertical solid lines highlight 1 cycle. Vertical interrupted lines denote the end of swing and beginning of stance phase.

