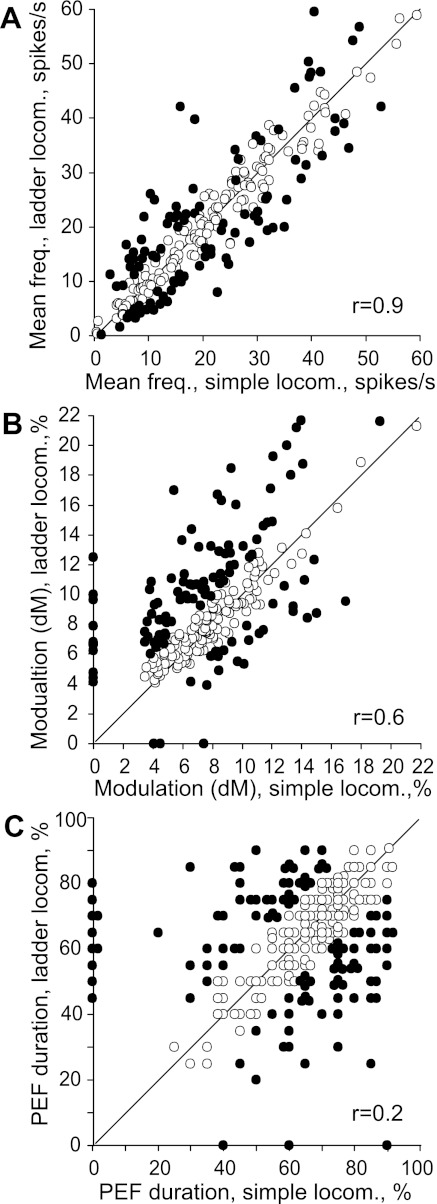
Fig. 9.
Comparison of activity characteristics of individual neurons during simple and ladder locomotion. The x- and y-axes of each point show the values of a characteristic of a neuron during simple and ladder locomotion, respectively. Neurons whose characteristics were statistically significantly different during the 2 tasks are shown by filled circles; the others are shown by open circles. A: mean discharge frequency averaged over the stride. B: coefficient of frequency modulation, dM. C: duration of PEF. For two-PEF neurons, the combined duration of two PEFs is given. The coefficient of correlation (r) is indicated.

