Fig. 3.
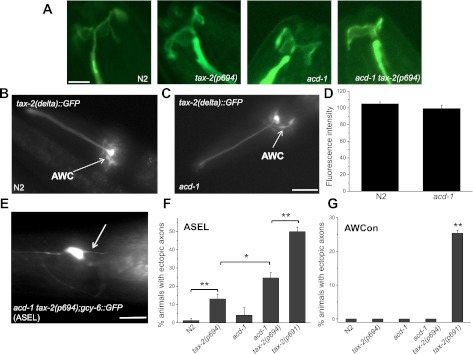
Morphological features of sensory neurons in tax-2 and acd-1 single and double mutants. A: Z-stack projections of confocal microscope photographs of wild type (N2), tax-2(p694), acd-1, and acd-1 tax-2(p694) animals expressing GCaMP1.0 in AWCon neurons. Apparent in all genetic backgrounds is the fan-shaped cilia of the AWC neuron. Scale bar, 4 μm. B and C: fluorescent photographs of wild type (N2) and acd-1 transgenic animals expressing tax-2(delta)::GFP. In both strains, the green fluorescent protein (GFP) construct that represents expression of TAX-2 in tax-2(p694) mutant animals is apparent in AWC neurons (arrows). Scale bar, 100 μm. D: the fluorescence intensity of AWC neurons expressing the tax-2(delta)::GFP transgene in wild type (N2) and acd-1 knockout genetic backgrounds was quantified. Quantification was done using ImageJ on photographs taken using a Leica microscope equipped with GFP filters with the same exposure time (1.5 s). Data are means ± SE. Means are not statistically different; n = 20 and 18 neurons, respectively. E: fluorescent photograph of a acd-1 tax-2(p694) double-mutant animal expressing gcy-6::GFP in the ASE left (ASEL) neuron. ASEL mediates attraction to Na+ (Suzuki et al. 2008). The arrow points to an ectopic axon. Scale bar, 50 μm. F: the percentage of animals showing ectopic axons in ASEL neurons was determined in wild type (N2), tax-2(p694), acd-1, acd-1 tax-2(p694), and tax-2(p691) animals in 3 independent experiments. Total number of animals analyzed was 40, 49, 30, 48, and 42, respectively. G: the percentage of animals showing ectopic axons in AWCon neurons was also quantified in wild type (N2), tax-2(p694), acd-1, acd-1 tax-2(p694), and tax-2(p691) animals. Total number of animals analyzed was 18, 34, 27, 16, and 40, respectively. AWCon neurons express GCamP1.0 under the control of str-2 (Chalasani et al. 2007). Data are means ± SE. *P < 0.05; **P < 0.01 (ANOVA). Note that acd-1 is not statistically different from wild type in ASEL ectopic axons quantification.

