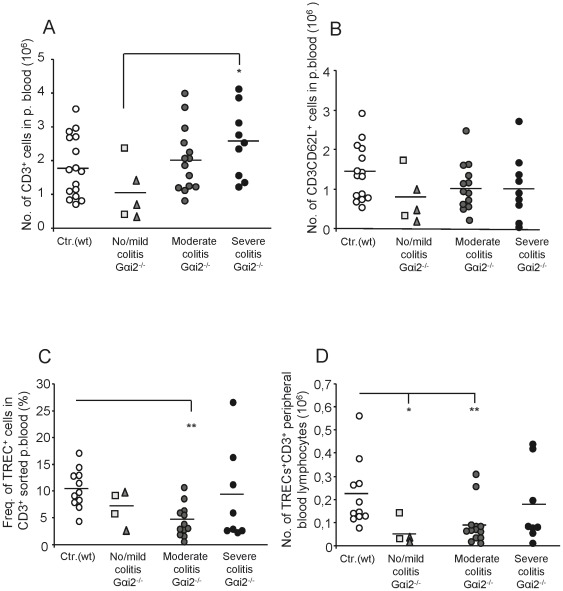
Figure 3. Decreased frequencies and numbers of TRECs in peripheral blood CD3+ T lymphocytes in colitic Gαi2−/− mice.
Peripheral blood was collected and the volume recorded from individual mice, whereafter Gαi2+/− mice were pooled (3 mice/pool) and analysed, while peripheral blood from Gαi2−/− mice was analysed individually. The control group of wt mice were 4–9 weeks old (n = 11–16, white circles) and the Gαi2−/− mice were 4–8 weeks old (n = 4–14, gray/black symbols), grouped based on their colitis scores (no colitis = rectangles, mild colitis = triangles). PBMCs were isolated from peripheral blood and the frequencies of CD3+ T lymphocytes was analysed by flow cytometry. The number of CD3+ (A) and naïve T lymphocytes (B) are presented as total T lymphocytes of the entire blood volume in each mouse, 6–8 ml blood per 100 g body weight [40]. (C) The frequencies of TREC+ lymphocytes were analysed by real time-PCR on isolated DNA from flow cytometry sorted peripheral blood CD3+ T lymphocytes. (D) Numbers of TREC+ CD3+ peripheral blood lymphocytes, as calculated from data (A) and (C). Horizontal lines indicate the mean within the group. Statistical analysis was performed using the Mann-Whitney non-parametric test and values of p≤0.05 were considered significant. *p≤0.05; **p≤0.01 and ***p≤0.001 between Gαi2−/− and wt mice.

