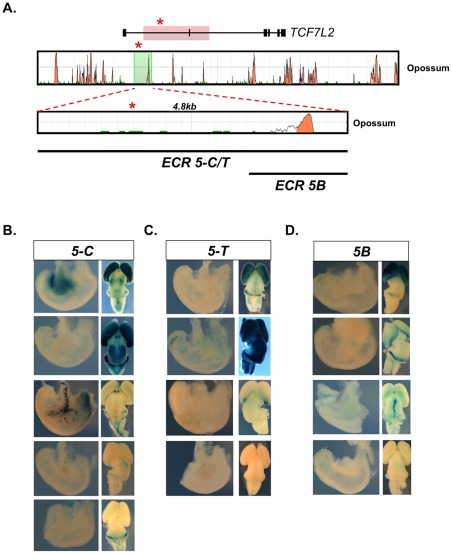
Figure 2. Functional analysis of SNP rs7903146.
(A) The association interval within the TCF7L2 gene locus is highlighted in red above. A red asterisk marks SNP rs7903146. Sequence conservation between human-opossum (ECR genome browser, [43]) is given for the entire association interval while the sequence tested is highlighted in green. Within the tested region, sequence conservation between human-opossum is given below (ECR genome browser). Positions of regions spanning SNP rs7903146 (5-C and 5-T) as well as a shorter sequence limited to the downstream ECR (5B) are shown below. (B)-(D) Images of pancreas (attached to the stomach) (left) and brain (right, dorsal view) obtained from independent transgenic lines (rows) are shown at E15.5 or E16.5 (ECR 5-C row 3 only). (B) and (C) Regions 5-C and 5-T exhibits inconsistent pancreatic staining while maintaining reproducible forebrain expression. (B) Construct 5B harbors forebrain expression but no pancreatic staining.

