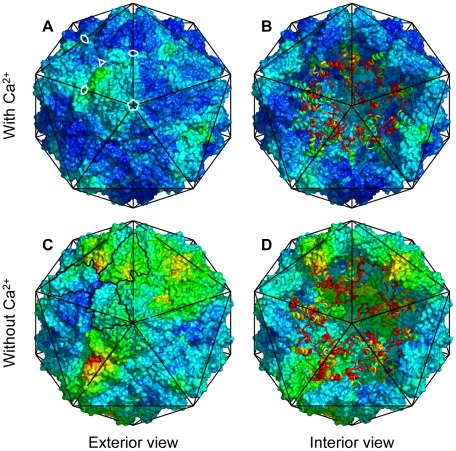
Figure 3. Structural changes of the capsid.
Van der Waals surfaces of the capsid shell after 1  viewed along one of the 5-fold symmetry axes. Top row (A, B) shows
  and bottom row (C, D) shows
  . Right column (B, D) shows the interior structure when the 15 frontmost proteins has been removed. Each capsid inscribed in an icosahedron with 22 nm between opposing vertices. The N-terminal domains are represented as ribbons. Colors according to the RMSd from the crystal structure. The color scale goes from blue (0.0 nm) through cyan, green, lime-green, yellow and red (
 ). Location of symmetry axes marked for one icosahedral face in (A). The outline of the proteins in one trimer traced in (C).

