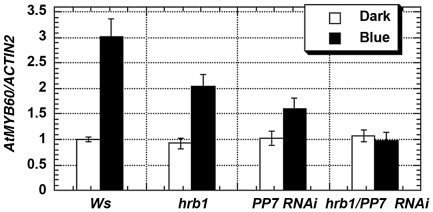
Figure 6. HRB1 and PP7 regulate the expression of MYB60.
Quantitative RT-PCR analysis shows the expression levels of MYB60 in Ws, hrb1, and PP7 RNAi lines in either a Ws (line 15) or hrb1 (line 27) background in the dark or under 4.93 µmol/m2/s blue light for 3 hours. The expression of MYB60 was examined with two biological samples and triplicate assays per biological sample. Data presented are means plus or minus standard errors.

