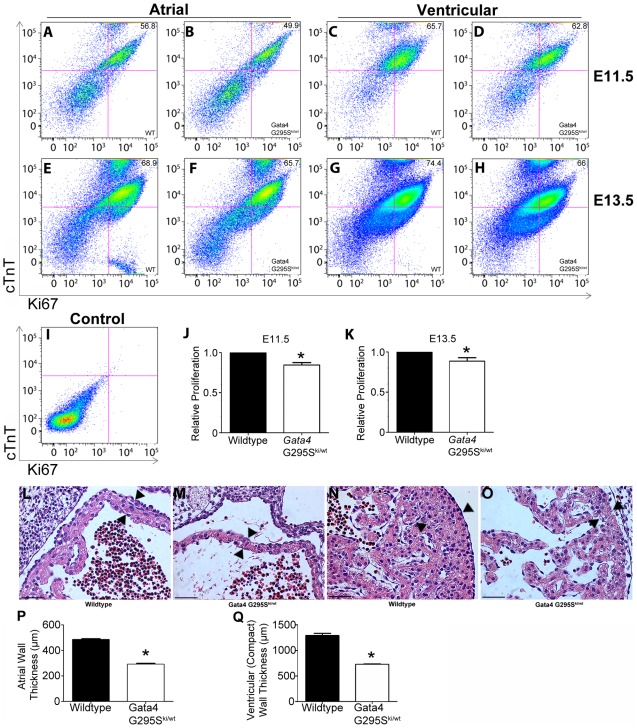
Figure 6. Proliferation deficits in Gata4 G295Ski/wt embryonic cardiomyocytes.
(A–I) Cells were isolated from wildtype (WT) and Gata4 G295Ski/wt E11.5 and E13.5 hearts. FACS analyses for cardiac troponin T (cTnT)-positive cells was performed for (A, B) E11.5 atria, (C, D) E11.5 ventricles, (E, F) E13.5 atria, and (G,H) E13.5 ventricles. Proliferating cells are detected by staining with Ki67. Representative data are shown in each panel. (I) FACS analysis of unstained cells used as a control. Quantification of proliferative cardiomyocytes in Gata4 G295Ski/wt mutant hearts as compared to wildtype littermate hearts at E11.5 (J) and E13.5 (K). Experiments were performed in triplicate using pooled hearts and all data are presented as means ± standard deviation; *p value<0.05. Coronal sections through the heart of wildtype (L, N) and Gata4 G295Ski/wt (M, O) E12.5 hearts. High magnification images of the atria (L,M) and ventricle (N, O) are shown. Quantitative analysis demonstrates decreased wall thickness in the (P) atria and (Q) compact ventricular myocardium in Gata4 G295Ski/wt as compared to wildtype littermates (n = 3 for each genotype). Arrowheads, representative site of measurement; *, p value<0.05. Scale bars indicate 200 µm.

