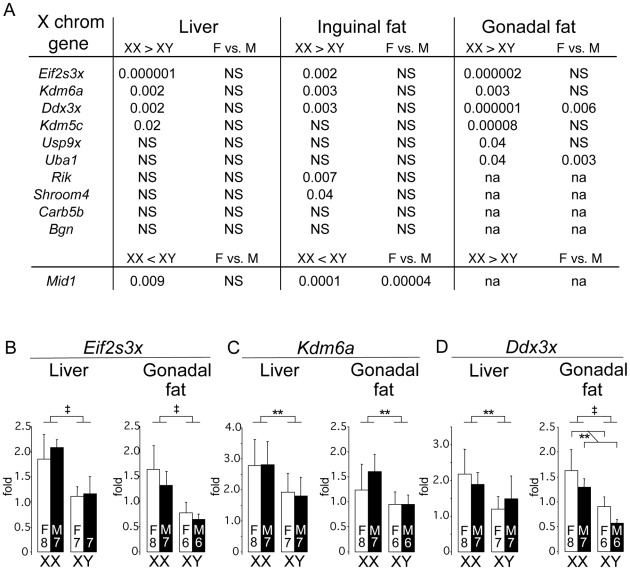
Figure 6. Differential gene expression in liver and fat tissues of X chromosome genes that escape inactivation.
Genes previously shown to escape X chromosome inactivation (see text) were assessed for expression levels by quantitative PCR in liver and adipose tissue (subcutaneous inguinal and gonadal depots) of gonadectomized, chow fed FCG mice shown in Figure 1B (10 months post-GDX). (A) Statistical differences in gene expression levels among the FCG genotypes for genes escaping X chromosome inactivation. For each gene, the p value for differences between XX and XY, and female (F) vs. male (M), are shown. Several escapees exhibit increased expression in liver and/or adipose tissues of XX compared to XY mice; a few genes also exhibit differences between levels in gonadal females and gonadal males. Mid1 shows a unique pattern, with lower expression levels in XX compared to XY tissues. The full name for Rik is 2610029G23Rik. NS, not significantly different. (B–D) mRNA levels are shown for liver and gonadal fat tissue of FCG mice for Eif2s3x, Kdm6a, and Ddx3x. Values shown for all bars represent mean ± SEM for the number of each genotype indicated. **, p<0.01; ‡, p<0.000001.

