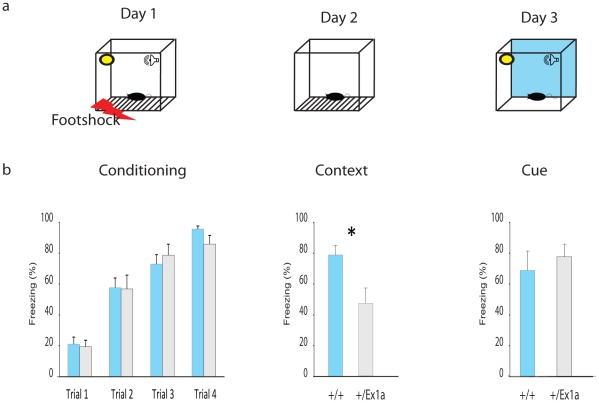
Figure 4. Fear conditioning performance.
(a) Representation of the FC protocol over three days and three different experimental phases (Conditioning, Context and Cue). (b) Mean percentage values of freezing behavior ± s.e.m. are plotted for each experimental phase. Statistics are reported as following: t-test; * = P<0.05.

