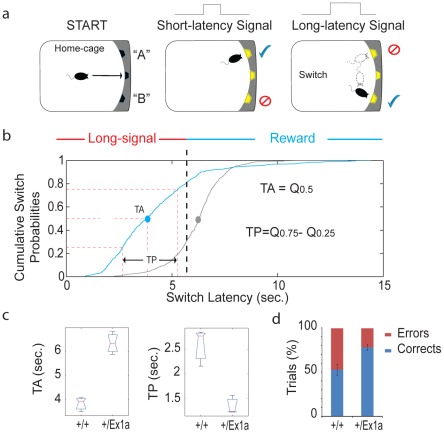
Figure 5. Cognitive performance in Exon 1A mice and littermate controls.
(a) A schematic representation of the “switch task” in which a mouse self-initiates the trial (“START”) and receives a reward according to the duration of the signal (“short-latency” versus “long-latency”) and the location (“A” or “B”). (b) The cumulative distribution of all switch latencies (the time at which the mouse stops nose poking in the short-location and moves to the long location) for all long-signal trials are reported for the +/Ex1a mice and their littermate controls. (c) From the above cumulative distribution of the switch latencies we have derived the Time Accuracy (TA), as the median (Q0.5), and the Time Precision (TP), as the difference of the third and first inter-quartiles (Q0.75−Q0.25), similar to what is described in [22]. Box-plots of TAs (the median values for each subject) and TPs (the inter-quartiles) are shown as well as (d) the percentage of correct versus error trials for the whole experiment. The correct/error trials graph refers only to the “Switch” condition, however, the same trend was observed in the “Probes” condition.

