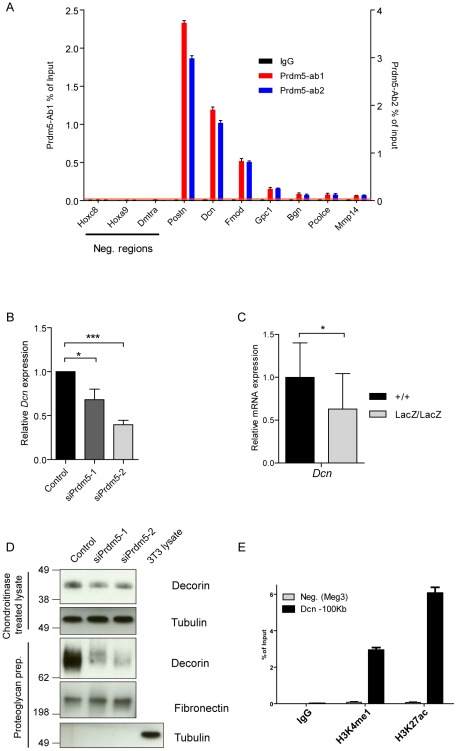
Figure 5. Prdm5 regulates Decorin through a distal enhancer.
A) ChIP-qPCR validation of Prdm5 peaks on selected ECM genes or negative regions from an independent sample immunoprecipitated with IgG, Prdm5-Ab1 (in black and blue respectively, plotted on left Y axis) or Prdm5-Ab2 (in red, plotted on right Y axis). Orange horizontal line represents the highest “noise” value obtained by ChIP-qPCR on a set of negative regions. B) qRT-PCR analysis of Decorin transcript (Dcn) levels upon Prdm5 knockdown as in Figure 4E. Results are presented as average of four independent experiments +/− SD; * = p<0.05. (C) qPCR analysis of WT and Prdm5LacZ/LacZ calvarial osteoblasts for Decorin. Expression values were normalized to the control WT samples. * = p<0.05; T-test, (+/+ n = 14, LacZ/LacZ n = 19 clones). D) Upper panels. Western blot analysis of Decorin levels upon Prdm5 knockdown in cell layers; Tubulin is used as loading control. Lower panels. Western blot analyses of purified proteoglycans from cell culture media from knockdown cells. Tubulin is used as purity control and Fibronectin for equal protein loading. E) ChIP-qPCR with indicated antibodies for Prdm5 binding site upstream of Dcn gene. Meg3 TSS region is used as negative control.

