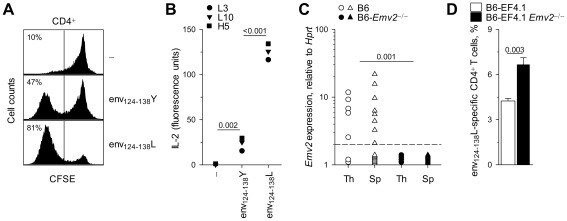
Figure 2. Emv2 selects against a fraction of env124-138L-specific CD4+ T cells.
(A) Dilution of prior CFSE label by primary EF4.1 CD4+ T cells incubated for three days in vitro in the absence of peptide stimulation (-) or in the presence of 10−5 M env124-138L or env124-138Y peptides. Numbers within the plots denote the percentage of CFSE− cells and are representative of 4 mice per condition. (B) IL-2 production by three env124-138L-specific hybridoma T cell lines in response to in vitro stimulation with the same peptides at 5×10⁻⁶ M. (C) Emv2 transcription, relative to Hprt transcription, in thymi (Th) and spleens (Sp) of wild-type B6 or Emv2-deficient B6 mice (B6-Emv2 −/−). Each symbol is an individual mouse. The dashed line represents the limit of detection. (D) Frequency of env124-138L-specific cells in primary CD4+ T cells from B6 (B6-EF4.1) or Emv2-deficient B6 (B6-EF4.1 Emv2 −/−) EF4.1 mice. Data are the means ± SEM (n = 9) from 3 experiments.

