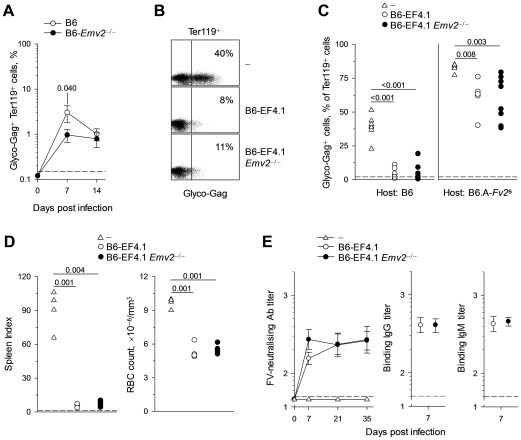
Figure 3. Emv2-selected CD4+ T cells retain full antiviral activity.
(A) Mean frequency (± SEM, n = 8–19) of FV-infected (glyco-Gag+) Ter119+ cells in the spleens of FV-infected B6 or Emv2-deficient B6 mice (B6-Emv2 −/−). (B–C) CD4+ T cells isolated from either B6 (B6-EF4.1) or Emv2-deficient B6 (B6-EF4.1 Emv2 −/−) EF4.1 mice were adoptively transferred into B6 or B6.A-Fv2 s recipients that were infected with FV the same day and analyzed 7 days later. (B) Flow cytometric example of FV-infected Ter119+ cells from B6 recipients and (C) frequency of FV-infected cells in Ter119+ cells from the spleens of B6 or B6.A-Fv2 s recipients of CD4+ T cells. Control B6 and B6.A-Fv2 s mice that received no CD4+ T cells (-) are also included. Each symbol is an individual mouse. (D) Spleen index (left) and RBC count (right) of B6-Rag1 −/− Fv2 s mice that were infected with FV and either received the same day CD4+ T cells isolated from either B6 (B6-EF4.1) or Emv2-deficient B6 (B6-EF4.1 Emv2 −/−) EF4.1 mice or no cells (-). Each symbol is an individual mouse analyzed 3 weeks post infection. (E) Titers of FV-neutralizing antibodies during the course of FV infection (left) and titers of F-MLV-infected cell-binding IgG (middle) and IgM (right) 7 days post FV infection, in the sera of B6-Tcra −/− mice that either received CD4+ T cells isolated from either B6 (B6-EF4.1) or Emv2-deficient B6 (B6-EF4.1 Emv2 −/−) EF4.1 mice or no cells (-) the day of the infection. Dashed lines represent the limit of detection. Data are the means ± SEM (n = 11–12) from 2 experiments.

