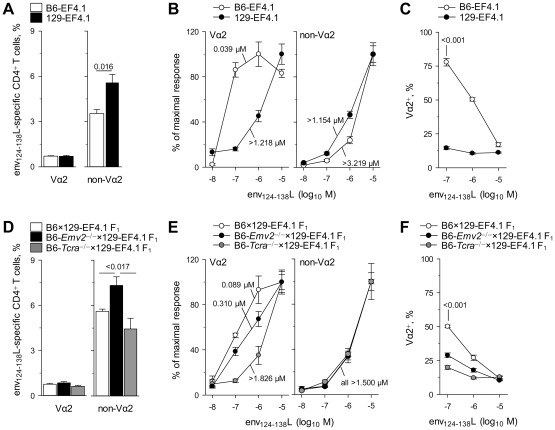
Figure 8. Genetic contribution to a high-avidity env-reactive CD4+ T cell repertoire.
(A) Frequency of env124-138L- reactive cells in Vα2 or non-Vα2 primary CD4+ T cells isolated from either B6 (B6-EF4.1) or 129S8 (129S8-EF4.1) EF4.1 mice. (B) Functional avidity of env124-138L-reactive Vα2 or non-Vα2 primary CD4+ T cells from the same donors in A. (C) Frequency of Vα2 cells in env124-138L-reactive CD4+ T cells from the same donors in A as a function of peptide concentration. (D) Frequency of env124-138L- reactive cells in Vα2 or non-Vα2 primary CD4+ T cells isolated from either B6×129S8-EF4.1 F1, B6-Emv2 −/−×129S8-EF4.1 F1 or B6-Tcra −/−×129S8-EF4.1 F1, EF4.1 mice. (E) Functional avidity of env124-138L-reactive Vα2 or non-Vα2 primary CD4+ T cells from the same donors in D. (F) Frequency of Vα2 cells in env124-138L-reactive CD4+ T cells from the same donors in D as a function of peptide concentration. Numbers in (B) and (E) represent the ED50. In (C) and (F) the CD4+ T cell response elicited by the last peptide dose (10−8 M) was too small to allow accurate measurement of the frequency of Va2 cells and was therefore omitted. Data in (A–F) are the means ± SEM (n = 4–8) of 18-hr stimulations from 3 experiments.

