
Figure 4.
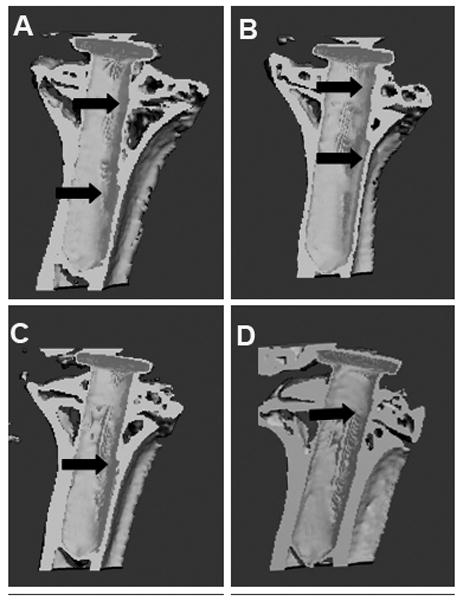
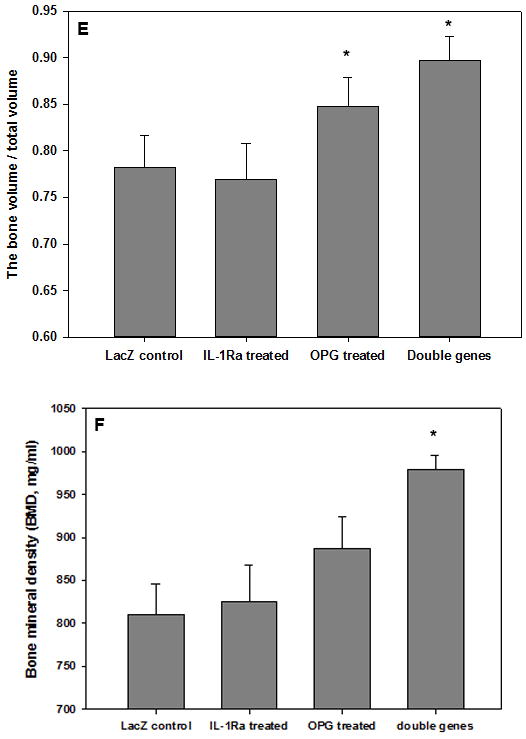
The analysis of bone remodeling. Representative μCT 3D construction images of the mouse prosthetic tibiae after 8 weeks of (a) LacZ-control; (b) IL-1Ra treated; (c) OPG gene modified; (d) double gene modifications. Arrows point out the focal bone erosions. The plot (e) summarizes the bone volume over total volume calculations by the μCT software among groups (*p<0.05); whereas (f) illustrates the quantitative analysis of bone mineral density changes following treatments (*P<0.05).