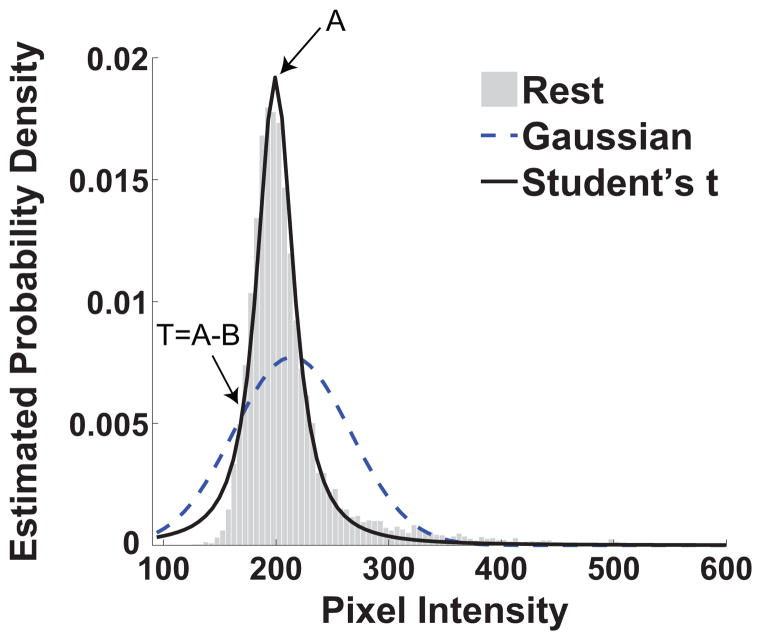
Figure 2.
Estimated probability density from a rest image with the corresponding location scaled Student’s t-fit and Gaussian fit are shown. The arrows indicate the location of the value of the scale parameter A (200) and the value of the threshold T (181.2). It is evident that the location scaled Student’s t-distribution fits the data closely particularly in the area of the mode of the empirical histograms.

